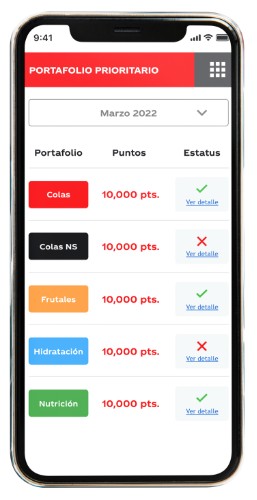
In today’s business world, having accurate and timely information is critical for making right decisions. Data analysis (datamining) has become a key tool to obtain valuable insights and anticipate future trends. One of the most powerful techniques in this regard is graphical trend analysis. In this article, we’ll show you how to make graph trend predictions for your business and get the most out of data analytics.
What is data analysis for companies?
Data analysis for business is the process of examining data sets to discover patterns, trends, and relationships that help make informed decisions. This practice has become increasingly relevant in an information-driven world. It allows companies to better understand their performance, identify growth opportunities and anticipate changes in the market.
One of the most effective forms of data analysis is graphical trend analysis. This technique uses historical data to identify patterns and predict future behavior. By representing the data in the form of graphs, it is easier to visualize and understand trends, allowing you to make decisions based on solid information. Next, we explain, step by step, how it is carried out.
Step 1: Collect the relevant data
The first step in performing a graphical trend analysis is to collect the necessary data. Identify what information is relevant to your company and how you can obtain it. You can use data analysis tools such as spreadsheets, databases, or specialized software to efficiently collect and organize data.
For example, if you want to predict your company’s monthly sales, you’ll need to analyze historical sales data for a specific period in time. The longer it is, the more accurate your predictions will be.
Step 2: Visualize the data in a graph
Once you’ve obtained the relevant data, it’s time to visualize it on a chart. Choose the chart type that best suits your data and goals. Some common examples are line charts, bar charts, or scatter charts.
The main objective is to identify any patterns or trends that may exist in the information collected. Notice if there are any seasonal fluctuations, changes over time, or any other patterns that might be relevant.
Step 3: Apply trend analysis techniques
Once you’ve visualized the data on a chart, it’s time to apply trend analysis techniques to predict future behavior. There are several techniques you can use, such as moving average, linear regression, or time series models.
The moving average, for example, allows you to smooth out the data and highlight the overall trend. Linear regression, on the other hand, helps you identify the relationship between variables and predict future values.
Step 4: Interpret the results and make predictions
Once you’ve applied your trend analysis techniques, it’s time to interpret the results and make predictions. Study the patterns identified in the chart and use this information to forecast future behavior.
Remember that predictions are not absolute guarantees, but they do give you a solid foundation for making informed decisions. Use your knowledge of the market and business context to evaluate the predictions and adjust your strategies accordingly.
If you need additional help in data analysis and implementing datamining techniques in your company, do not hesitate to contact LMS. We have a team of experts in data analysis and we can provide you with the necessary support to make the most of the potential of your business information. Don’t wait any longer and contact us today to start unlocking the hidden value in your data!


